Five Million Factory Robots: What the Latest Data Means for Servo Selection
IFR’s World Robotics 2026 report presents industrial-robot data for 2025. For servo selection, the relevant requirements are the movement, load, speed, duty cycle, power supply and physical limits of the mechanism.
Data note, updated October 2026: the latest complete-year industrial-robot figures available were released in September 2026 and cover 2025. The 2026 and 2029 figures below are forecasts, not completed-year results.
Factories installed a record 603,000 industrial robots in 2025, an 11% increase over the previous year. The number already operating worldwide reached 5.079 million, up 9%. Those two totals describe different things: installations count new robots added during one year, while operational stock is the accumulated fleet still in use.
Sources: IFR World Robotics 2026 release and IFR market presentation (24 September 2026, industrial-robot slides 8–14 and forecast slide 22).
Installation totals do not identify the actuators used in each robot. Select a component against the electrical, mechanical and environmental requirements of the individual axis.
The latest numbers, read in context
| Measure | 2025 result | What it describes |
|---|---|---|
| New industrial-robot installations | 603,000 (+11%) | Robots added during the year |
| Operational stock | 5.079 million (+9%) | Robots operating in factories worldwide |
| Collaborative-robot installations | 66,000 (about 11%) | A segment of annual installations |
Annual installations count new robots added in one year. Operational stock counts the robots still in use. The measures describe different parts of the market.
Growth is not the same in every market
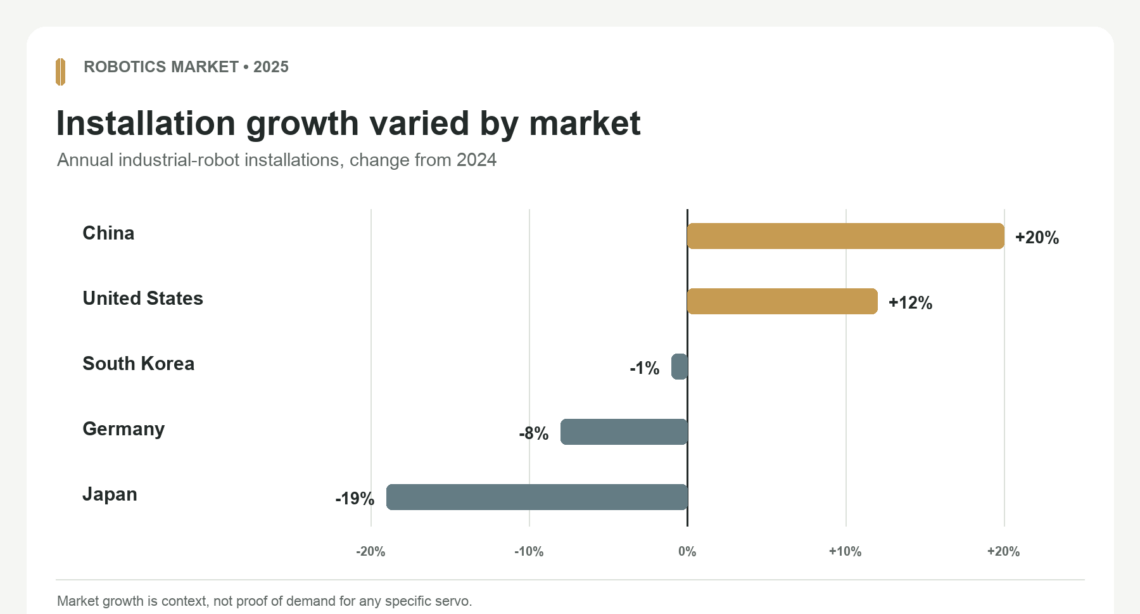
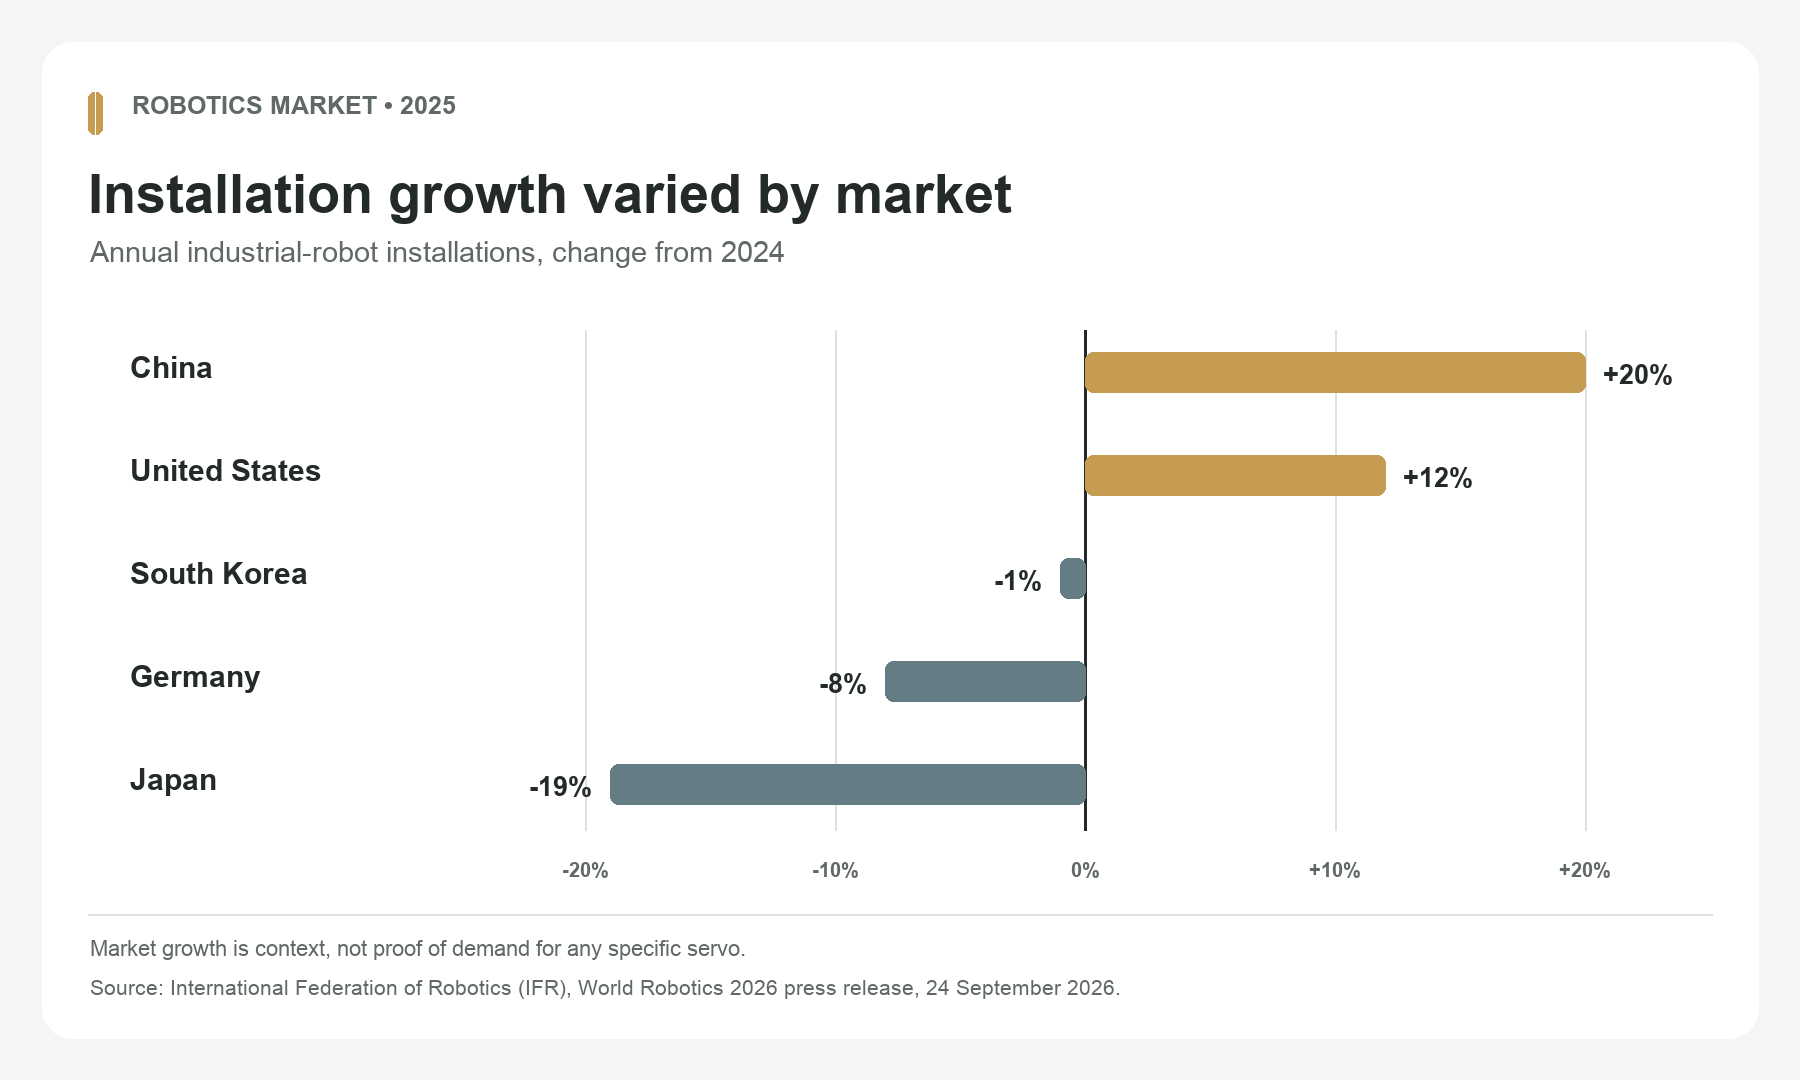
The regional picture is mixed. China and the United States recorded strong growth, while some established markets contracted. India and Brazil also posted notable increases from smaller bases.
| Market | 2025 installations | Change | Reading the result |
|---|---|---|---|
| China | About 354,000 | +20% | 59% of global installations |
| United States | About 38,500 | +12% | Second-largest market in 2025 |
| India | About 10,500 | +15% | Annual installations grew quickly from 2020 to 2025 |
| Brazil | About 4,300 | +38% | Automotive demand contributed to the increase |
| Japan | 36,219 | -19% | Lower installations than the prior year |
| South Korea | About 30,000 | -1% | Close to recent annual levels |
| Germany | Fewer than 25,000 | -8% | Lower installations than the prior year |
Industry demand moved too: installations in automotive and electronics each increased by 10%, while metal and machinery rose by 22%. These sector changes help explain where investment was stronger, but they still do not identify a standard actuator or servo configuration. A production line can combine many robot types and motion architectures.
2026 and 2029 Forecasts
Current projections put global installations at about 655,000 in 2026 and 806,000 in 2029. These are forward-looking estimates, not measured 2026 totals. As of October 2026, the year is still underway, so a full-year actual count is not yet available.
For inventory planning, consider the industries and regions you serve. Growth in the overall robot market does not establish demand for a particular servo model.
A practical servo-selection sequence
Start with the joint or mechanism, then work outward to the component.
- Describe the motion. Record the moving load, arm length, direction, travel, acceleration, and any external force.
- Set the operating profile. Write down target speed, cycle time, how long the axis holds position, and how often it repeats.
- Check the power and control path. Confirm supply voltage, available current, controller outputs, signal type, and communication protocol.
- Confirm mechanical fit. Compare mounting dimensions, shaft or spline, horn options, cable route, and clearance at both ends of travel.
- Match the environment. Check temperature, dust, moisture, vibration, and maintenance access against the exact model’s documented limits.
Then check torque and speed under the conditions the axis will actually see. A peak or stall-torque figure on its own does not establish continuous capability, thermal suitability, or safe operation. If the datasheet does not state the condition you need, ask for clarification before designing around that value.
Examples from the City of Machinery catalogue
The catalogue includes different size and design categories, including the Kpower P0090FH 9 g micro servo, the DS3240 waterproof digital servo, and the BLS4355 low-profile brushless servo. These are examples from the catalogue, not a claim that any one model is suitable for an industrial robot axis. Compare the exact model documentation with the application requirements before selecting a part.
Watch a short robotics market briefing
Watch the market briefing below for an overview of the IFR figures.
When asking City of Machinery to compare a component, include the model under consideration, target torque and speed, voltage, control method, physical constraints, operating environment, and quantity.